New Tools for Monitoring Hazardous Volcanic Ash
April 16, 2019
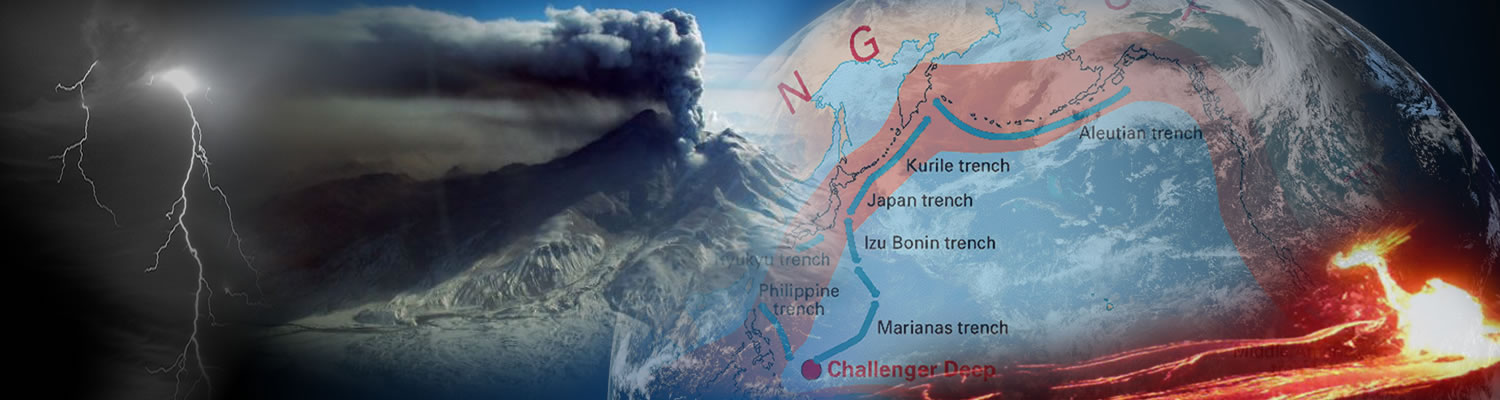
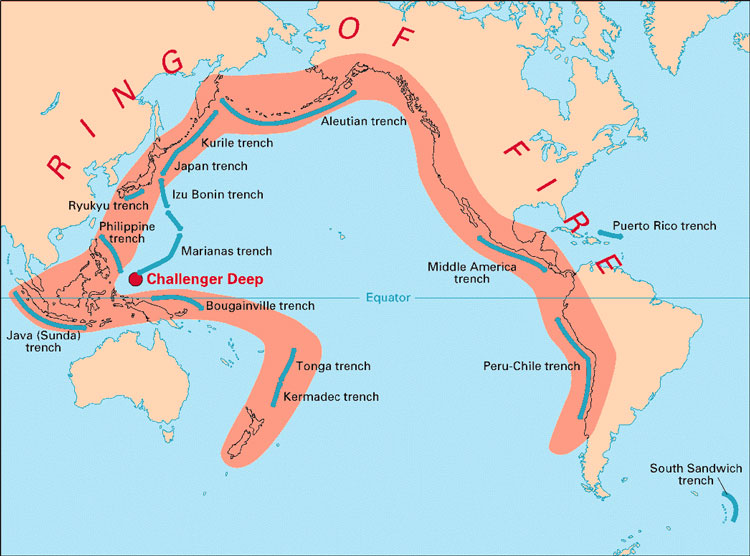
Volcanic ash is a significant health, aviation, infrastructure and economic hazard. New spectral channels, improved resolution, and faster scanning from the GOES-16 (GOES East) and GOES-17 (GOES West) Advanced Baseline Imager (ABI) allow for sophisticated new data products and better detection of volcanic ash. GOES East and GOES West observe a significant fraction of the most volcanically active region on Earth, known as the “Pacific Ring of Fire,” which includes the western portions of North and South America, East Asia, Indonesia, Micronesia, and New Zealand.
Volcanic emissions generate complex clouds that can affect local, regional, or even global weather, and these clouds often contain volcanic ash, a major hazard. Given the remote location of most volcanoes and the rapid formation and expansion of volcanic clouds, geostationary satellites are the primary tool for monitoring volcanic clouds. Timely and accurate detection and tracking of volcanic ash is critical for maintaining safety and minimizing economic loss.
Volcanic Ash Advisory Centers (VAACs) are responsible for issuing volcanic ash advisories 24/7. VAAC forecasters use information from the Advanced Baseline Imager flying aboard GOES-16 and GOES-17 to monitor clouds whose location, evolution and/or spectral properties are consistent with volcanic activity. The ABI can also be used to estimate the height of ash clouds, determine the extent of ash, and estimate the amount of ash present in each satellite pixel. Visible and infrared ABI channels can be combined to create RGB (red-green-blue) products that allow for better discernment of features like ash and hot spots.
ABI is also sensitive to sulfur dioxide (SO2), a noxious gas often produced by volcanic eruptions. SO2 detection is a new capability offered by the GOES-R Series ABI, due to new infrared channels that previous GOES imagers lacked.
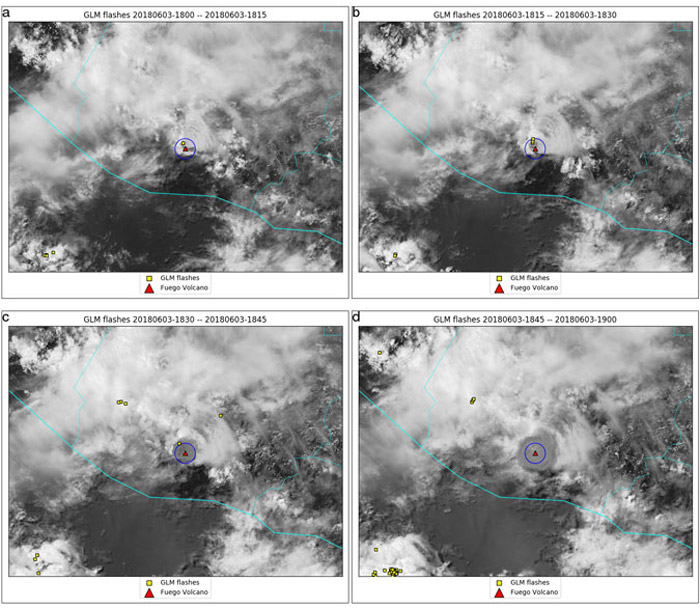
Explosive volcanic eruptions often generate lightning, though why is not yet fully understood. The GOES-R Series Geostationary Lightning Mapper (GLM) has potential to improve eruption detection and characterization. One June 3, 2018, a series of explosive events from the Fuego volcano in Guatemala generated lightning. GLM observed flashes for the first explosive event, and initial analysis suggests that attributes of the GLM-observed lightning from the volcanic event differed from lightning associated with nearby meteorological convection. Additional analysis is needed, but this unique application could prove beneficial. The combination of GLM and ABI data may produce new insights about volcanic eruptions and volcanic cloud behavior.
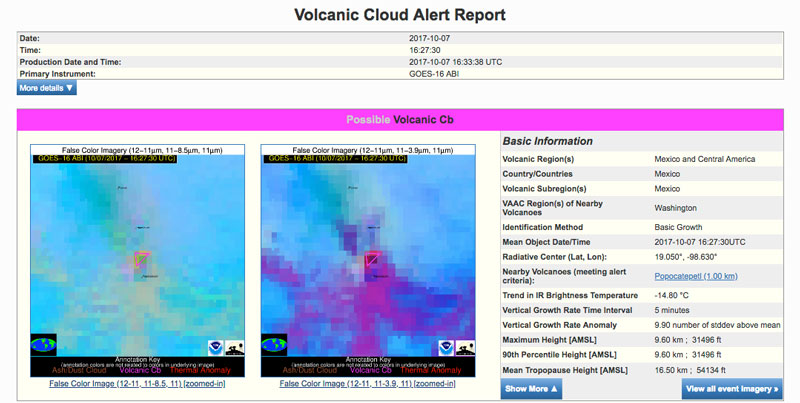
Approximately 90% of the world's volcanoes are not regularly monitored for activity. In addition, the large volumes of satellite data now available make manual examination impractical. One GOES-R Series satellite makes over 150 billion observations of Earth each day. The need to distill large volumes of GOES-R data into actionable information and for timely volcanic eruption detection led to the development of an automated detection tool. The VOLcanic Cloud Analysis Toolkit (VOLCAT) is a collection of software developed by NOAA, in partnership with the University of Wisconsin‐Madison. VOLCAT generates alerts when volcanic unrest or an eruption is detected and also automatically tracks and characterizes volcanic clouds. The alerts are in the form of a hyperlink, distributable via e‐mail or Short Message Service. The hyperlink points to a web‐based alert report that includes information on the cloud growth anomaly, a list of most likely source volcanoes, and relevant satellite imagery. The VOLCAT alerts are currently distributed to expert users at Volcanic Ash Advisory Centers and Volcano Observatories in an experimental manner. Work is underway to include SO2 alerts and GLM lightning information in the VOLCAT tool.
As forecasters gain more experience with new GOES-R Series datasets, the value of the measurements will increase significantly. With continued development of GOES-R tools, volcanic hazard forecasting and monitoring will improve considerably, resulting in safer and more efficient air transportation and a better understanding of volcanic processes and the complex relationship between volcanic emissions and weather and climate.
Thanks to Michael Pavolonis, NOAA/NESDIS Center for Satellite Applications and Research, and Justin Sieglaff and John Cintineo, Cooperative Institute for Meteorological Satellite Studies. University of Wisconsin-Madison, for providing information and data for this story.