
Measuring Winds to Help Predict the Weather
November 20, 2019
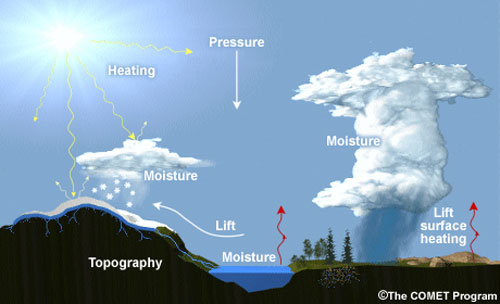
Wind is a fundamental variable of weather. The heating of Earth’s surface and atmosphere by the sun drives winds that move heat and moisture from one place to another. Variations in large-scale wind circulation patterns are responsible for the daily weather we experience. Observations of wind speed and direction, along with other elements like temperature and moisture, are essential for estimating the state of the atmosphere at specific times and locations on Earth. This information helps weather forecasters understand current weather conditions and informs Numerical Weather Prediction (NWP) models that provide forecasts of weather and climate.
Satellite wind estimates
Satellites estimate winds by tracking the motion of clouds (or water vapor features in the absence of clouds) observed in a sequence of satellite images. Satellite winds are often referred to as derived motion winds or atmospheric motion vectors. Forecasters use wind estimates from satellites in low Earth orbit and geostationary orbit. Low Earth-orbiting satellites circle Earth from pole to pole and observe the same location twice daily. Winds from these satellites are typically derived over Earth’s polar regions. Geostationary satellites, like GOES-16 and GOES-17, provide frequent images over the same area. This is especially useful when tracking clouds because they often change shape as they evolve or dissipate. This frequent imaging allows for nearly continuous generation of wind estimates.
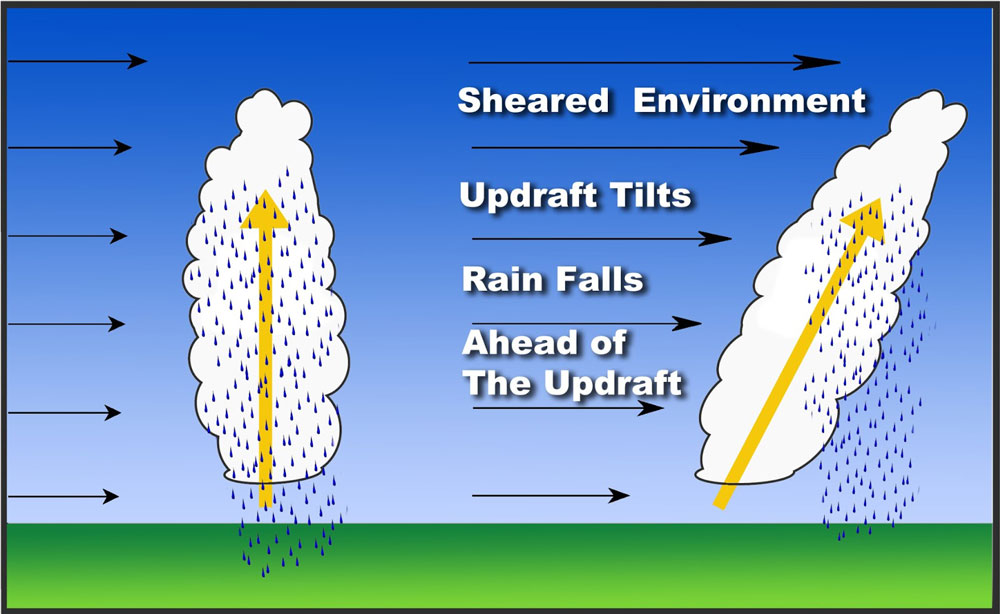
Satellite winds are among the most important information contributing to the accuracy of global NWP models. In addition to their importance to NWP, satellite-derived winds also represent an important set of observations to NOAA/National Weather Service (NWS) forecasters who use these winds for a variety of reasons that include gauging the correctness of NWP model forecast guidance, identifying localized jet streaks, and determining vertical wind shear. Vertical wind shear, the change in wind's direction and speed with height, is a critical factor in determining whether severe thunderstorms will develop.
GOES-R derived motion winds
The GOES-R Series Advanced Baseline Imager (ABI) offers 16 spectral channels (to generate new and improved data products), higher spatial resolution (to better monitor small-scale atmospheric features) and faster imaging (to provide near real-time information), all of which enable large quantities of high-quality wind estimates for forecasters. Satellites from the GOES-R Series generate more than five times the amount of wind data than previous GOES.
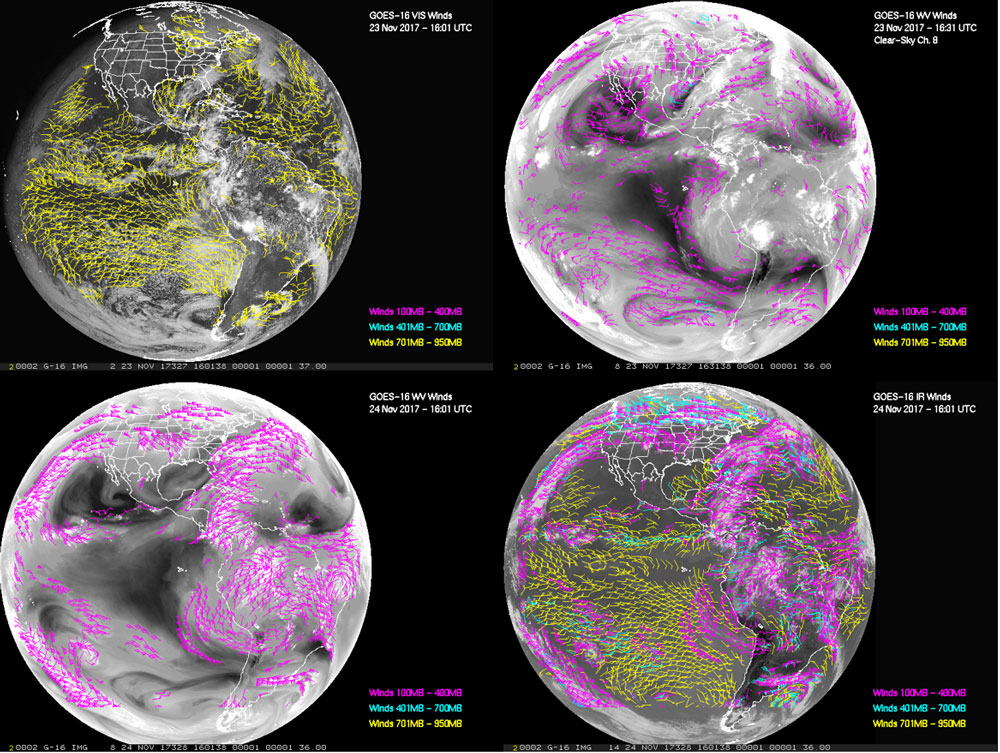
The GOES-R derived motion winds data product uses a sequence of three ABI images to arrive at an estimate of atmospheric motion for a set of targeted features. These features can be clouds, or in the case of clear-sky conditions, moisture. Six ABI spectral channels are used to generate wind estimates. Different ABI channels are used depending on the intended target and location (low, mid, upper troposphere) in the atmosphere where the winds will be generated. The displayed winds can provide specific information such as time, temperature at the pressure level of the winds, wind direction, and wind speed of individual winds.
Hectopascals and millibars
The hectopascal (hPa) and millibar (mb) are both units for measuring atmospheric pressure and are commonly used in meteorology. They are each equal to 100 pascals. GOES-R wind estimates can be expressed in hPa or mb.
Applications for forecasting
The ABI enables more accurate wind estimates for targeted areas, which can be used in new applications to improve forecasts of high-impact weather events such as hurricanes and severe thunderstorms. The ability to characterize the wind fields in and around a hurricane is crucial to predicting future storm motion and intensity. Wind estimates from GOES-16 and GOES-17 define the wind flow over and around hurricanes, highlight the center of circulation, indicate the direction the storm will move, and provide valuable information on conditions that can lead to rapid intensification. This is also true for extratropical cyclones, like nor’easters.
Wind estimates from GOES-16 and GOES-17 provide weather forecasters with important information to highlight key ingredients of storm development, including diagnosing vertical air motion, identifying areas of strong wind shear in a pre-storm environment, providing visualization of atmospheric shear, and determining the speed and progression of a jet streak. GOES wind estimates can even be used to track the transport of dust or smoke from wildfires to warn the public of impending visibility and air quality hazards.
Thanks to improved resolution, faster scanning, and new imager channels, the GOES-R Series ABI is providing more and better estimates of winds. This means improved tools for forecasters and a better understanding of impending severe weather.
Jaime Daniels (NOAA/NESDIS/STAR), the National Weather Service, and the COMET Program contributed information and imagery for this article.