2017: The Year of GOES-16
December 27, 2017
This year, forecasters had a revolutionary new forecasting tool at their disposal – NOAA’s GOES-16 satellite. Launched in 2016, GOES-16 spent most of 2017 going through an extended checkout and validation phase to calibrate its advanced instruments and test new data products. That didn’t stop the satellite from providing vital data on severe storms, hurricanes, wildfires and other weather hazards throughout the year. GOES-16 generated 299 terabytes of data in 2017! The satellite detected more than 18 billion lightning events and collected more than 13 million mesoscale images.
Brand new instrumentation, additional spectral information, improved resolution, and faster scanning ability, as well as new product development allow GOES-16 to provide information on meteorological features like never before. Thanks to GOES-16, forecasters and emergency managers are better equipped with more accurate weather predictions and faster warnings.
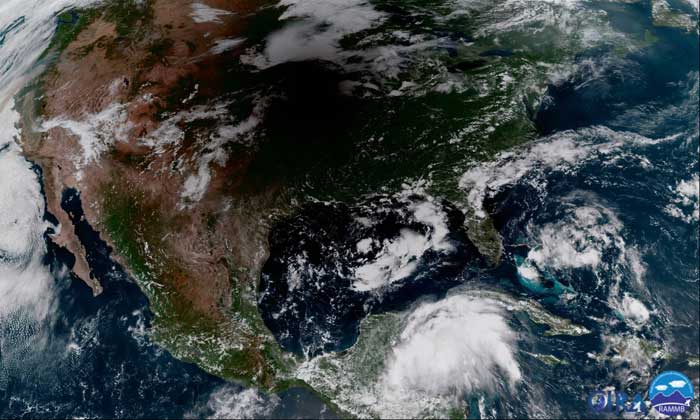
On December 18, 2017, GOES-16 officially entered operational service as NOAA’s GOES East satellite. Perched 22,240 miles about the equator, GOES East is now keeping an eye on North and South America and the Atlantic Ocean all the way to the west coast of Africa. Let’s take a look back at GOES-16’s momentous year in geostationary orbit.
Improved Forecasting of Severe Storms
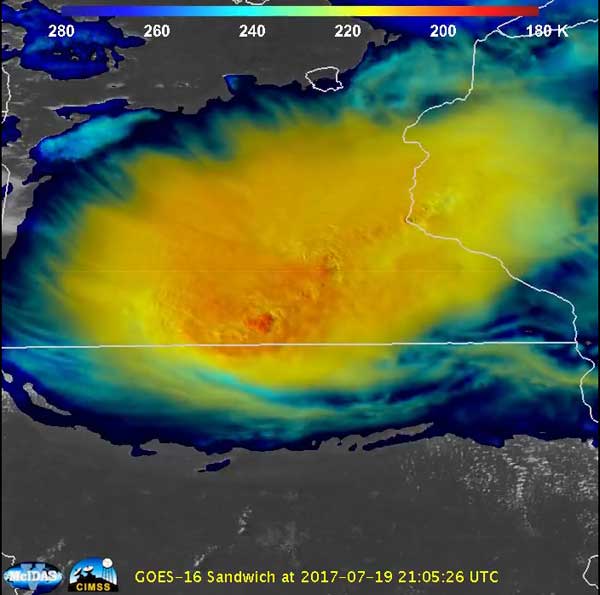
Compared to the previous GOES imager, the GOES-16 Advanced Baseline Imager (ABI) provides three times more spectral information to discern cloud properties and the near-storm environment. It also has four times the resolution to resolve finer detail, and scans five times faster to provide more timely indications of evolving and intensifying severe storms. View GOES-16 combined visible and infrared imagery of the derecho that drifted across South Dakota and Minnesota and into northern Iowa on July 19.
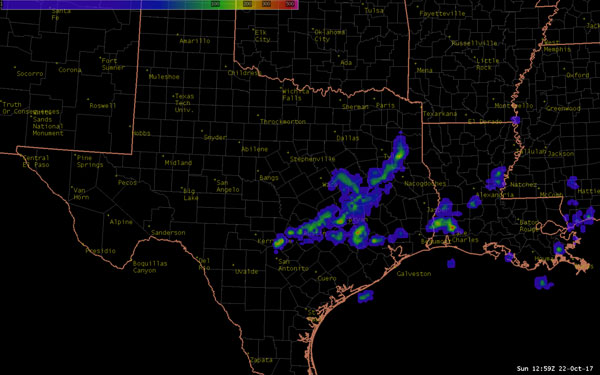
In addition, GOES-16 flies the first lightning mapper in geostationary orbit. The Geostationary Lightning Mapper (GLM) collects information such as the frequency, location and extent of lightning discharges. The instrument measures total lightning, both in-cloud and cloud-to-ground, to aid in the forecasting of developing severe storms. Rapid increases in lightning, particularly in-cloud lightning, indicate that a storm is strengthening quickly and could produce severe weather. View an animation that combines GOES-16 Advanced Baseline Imager (ABI) and Geostationary Lightning Mapper (GLM) data for severe storms over Wisconsin on July 12, 2017
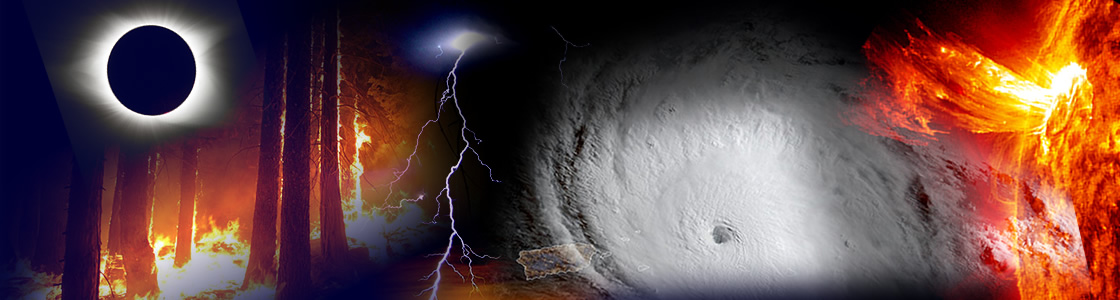
Total Solar Eclipse
On August 21, the first total solar eclipse to move across the United States in 99 years occurred. GOES-16 captured the moon’s shadow as it traveled diagonally across the path of totality in the continental United States from the Pacific Northwest through South Carolina.
A Record-Breaking Hurricane Season
Three major hurricanes (category 3 or higher) made U.S. landfall during the 2017 Atlantic Hurricane Season and the advanced capabilities offered by GOES-16 aided forecasters in tracking the storms. On September 20, Hurricane Maria knocked out radar in San Juan, Puerto Rico, as it neared the island. With this critical technology disabled and a major hurricane approaching, forecasters were able to utilize data from GOES-16 to track the storm in real-time. The rapid scan rate of the ABI allows forecasters to see tropical storms as they’re developing, providing earlier warning and improving track forecasts.
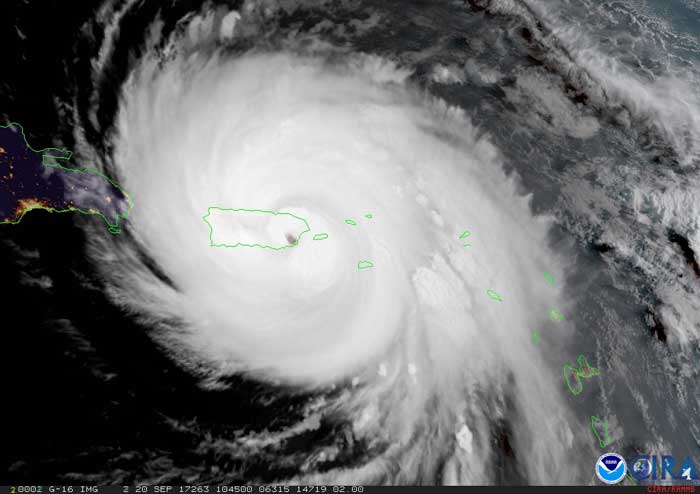
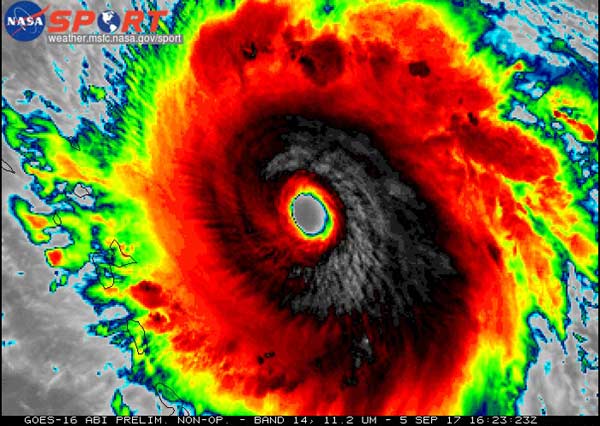
The GOES-16 ABI also has additional channels not available on previous GOES. For instance, band 13, the “clean” longwave infrared band, is used to monitor clouds and storm intensity. Infrared imagery from GOES-16 helps forecasters analyze cloud patterns in near-real time, allowing for estimations of central pressure and maximum sustained winds. In addition, the increased resolution from the ABI provides greater accuracy of feature attributes, allowing for better characterization of small hurricane eyes, which also helps with intensity estimation and tracking.
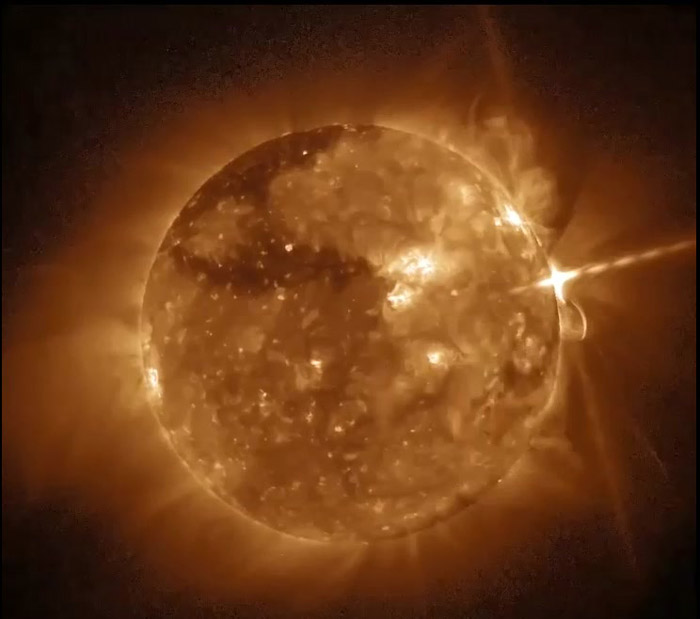
Keeping an Eye on Solar Activity
Solar eruptions can cause geomagnetic and solar radiation storms, which can disrupt power utilities and communications and navigation systems, damage satellite electrical systems, and cause radiation damage to orbiting satellites, high-latitude aircraft, and the International Space Station. Luckily, GOES-16 is watching the weather in space as well as on Earth. The Solar Ultraviolet Imager (SUVI) observes and characterizes complex active regions of the sun, solar flares, and the eruptions of solar filaments that may give rise to coronal mass ejections.
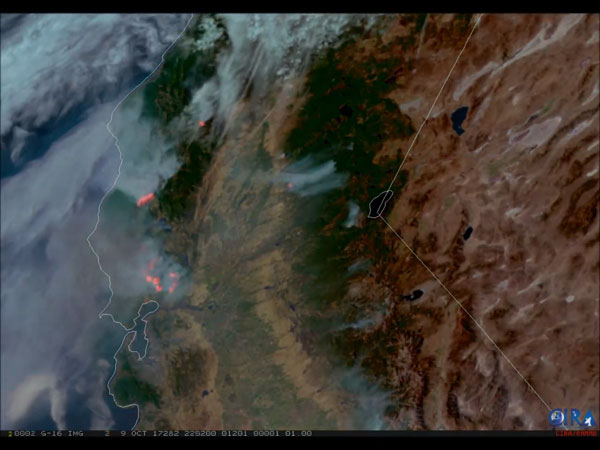
Deadly Wildfires
GOES-16 allowed National Weather Service forecasters to provide proactive, tactical wildfire decision support services during a very active 2017 fire season, the deadliest in California’s history. The increased resolution along with reduced latency give forecasters the ability new fires much quicker than ever before and relay detailed tactical information about fire progression and spread to state and county agencies. This often occurs before fires are spotted on the ground – often 10 to 15 minutes before emergency notifications to 911. Special fire temperature RGB (red-green-blue) imagery is used to detect hot spots. This imagery is created using three shortwave and near-infrared ABI bands. Active hot spots show up as red, yellow and white as the fires grow increasingly hotter. The imagery can be combined with a geocolor enhancement so both a fire’s hot spots and smoke plumes are visible.
GOES-16 is proving to be a game-changer for weather forecasting and hazard assessment, helping to build a Weather-Ready Nation. Next year, GOES-16 will be joined in orbit by GOES-S, the second satellite in the GOES-R Series. GOES-S arrived at NASA’s Kennedy Space Center in December to prepare for a March 1, 2018 launch. GOES-S will be designated GOES-17 after reaching geostationary orbit. After a period of on-orbit test and checkout, GOES-17 will be operational as GOES-West, providing coverage of the western U.S., Alaska, Hawaii and the Pacific Ocean. An operational GOES-17 will extend the coverage of the revolutionary new technology provided by GOES-16. Together, GOES-16 and GOES-17 will observe the majority of the Western Hemisphere from the west coast of Africa all the way to Guam.
View more amazing GOES-16 imagery.
Check out the best moments of 2017 from NOAA’s Satellite and Information Service